Data
The data used in this study is in three parts. The first data set is the training data, this data is a small subset of the 2005 waveform data that will be used to predict all over inputs. This training data is made of all 2005 waveform footprints that fall within ~60 pre-classified plots.
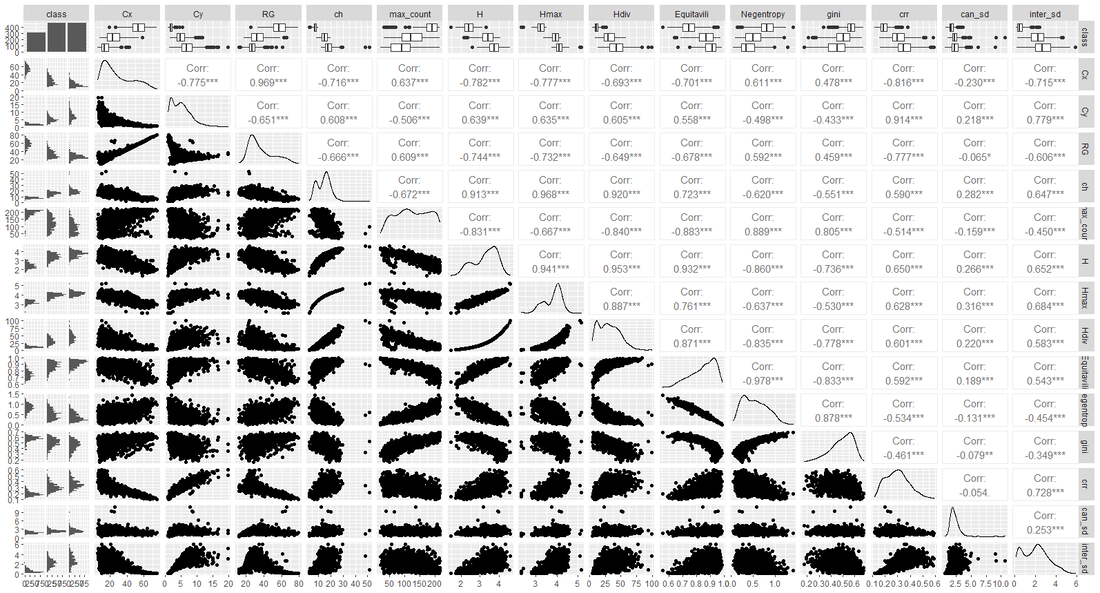
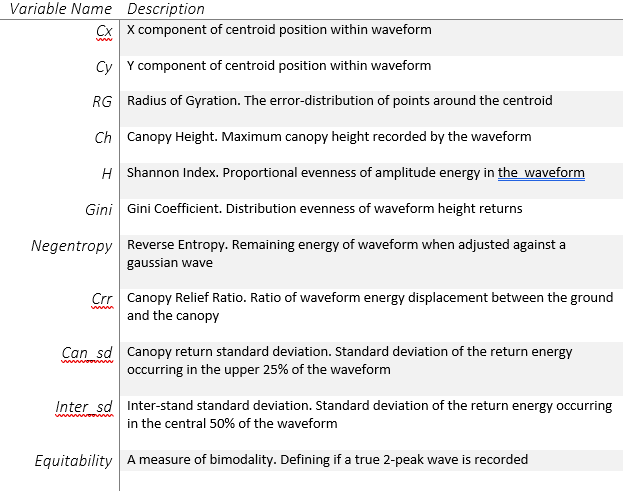
In the original set of structural metrics, there were numerous height-based metrics. This resulted in having several correlated metrics. To avoid this, these metrics were summarized as a max value and 2 standard deviation metrics ('can_sd' and 'inter_sd').
In the original set of structural metrics, there were numerous height-based metrics. This resulted in having several correlated metrics. To avoid this, these metrics were summarized as a max value and 2 standard deviation metrics ('can_sd' and 'inter_sd').
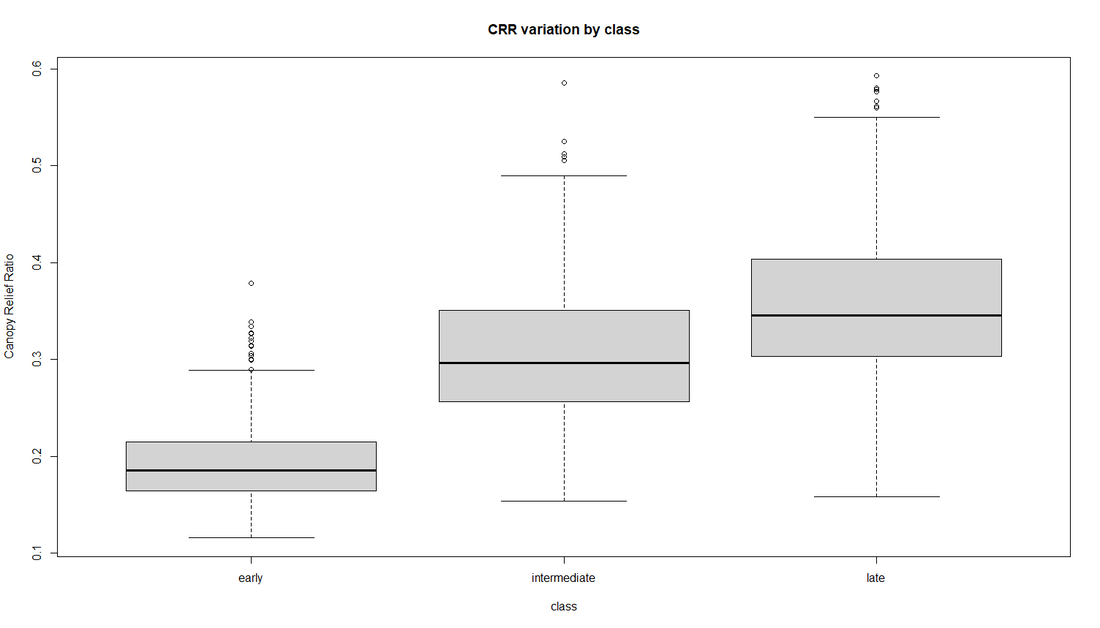
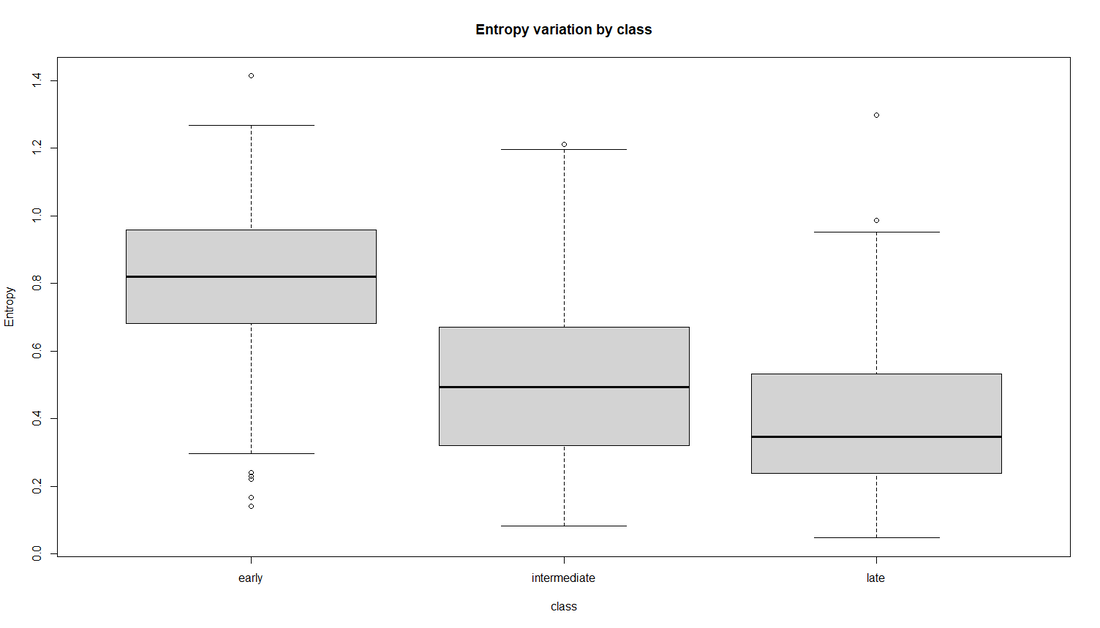
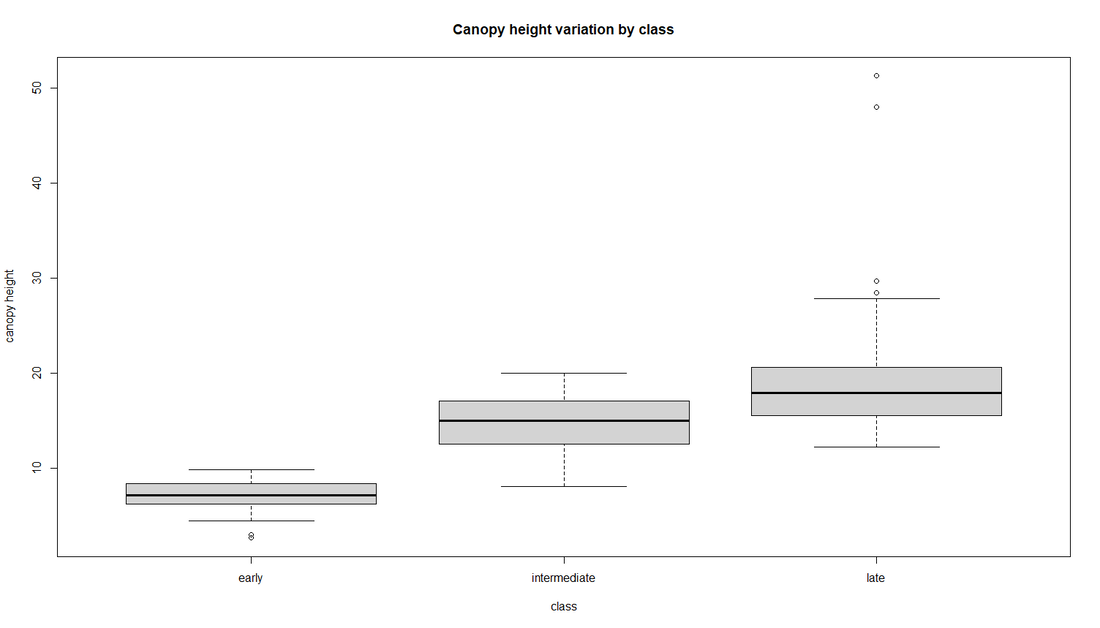
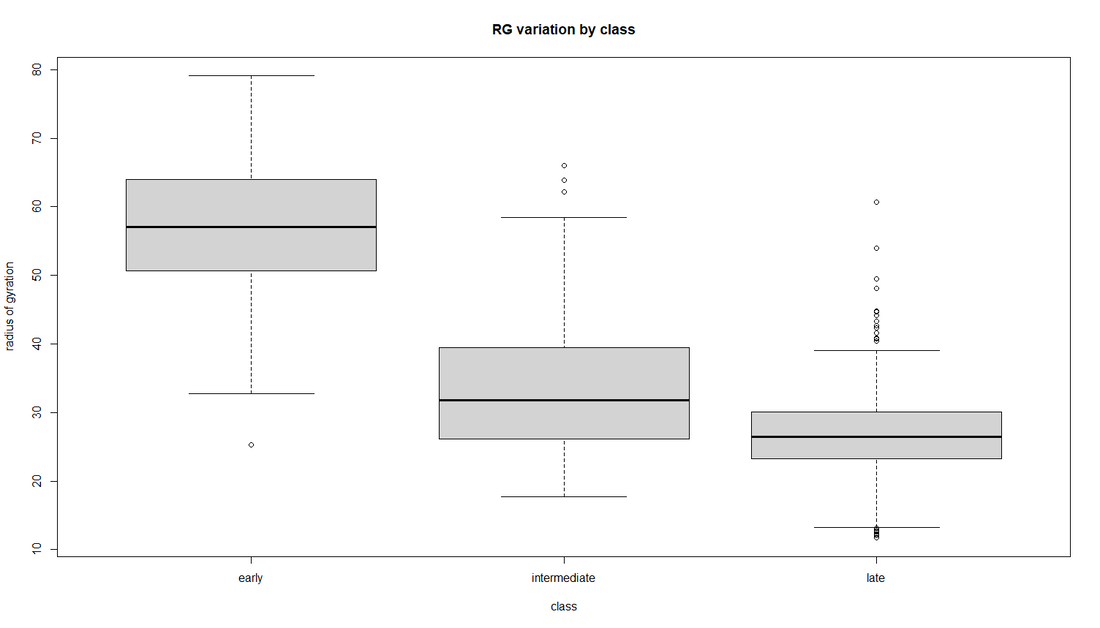
Fig 2. Box plots for some metrics of importance. CRR is the canopy relief ratio and RG is the radius of gyration. Overall each boxplot shows weak to moderate trends when considering succession.
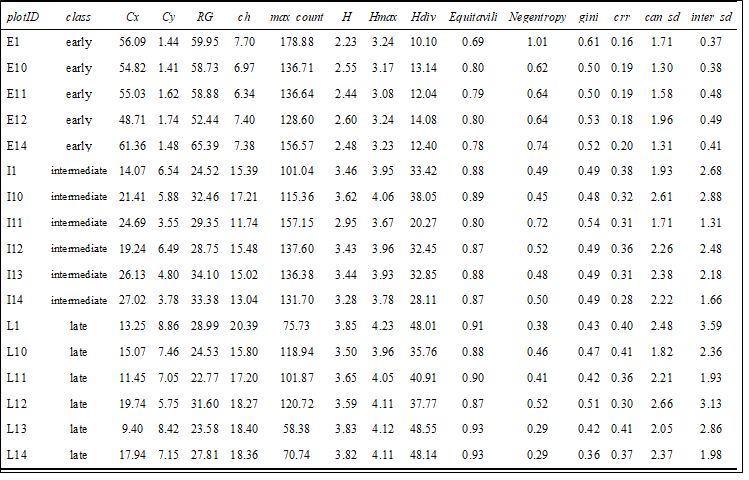 Fig 3. Subset table showing individual value examples for each succession class.
On the left is a table with a few examples of how the data is structured. As previously mentioned this is waveform data, but the study is not using the waveform itself but rather metrics that were derived from and describe each waveform. Here I have a variety of metrics, some of which were cut from the final analysis. Metrics range from centroid components (Cx, Cy), to error distributions RG (radius of gyration) to other forms of order and equality (i.e Negative Entropy). Each metric has been selected as it may potentially describe different portions of the waveform and thus forest structure within that footprint.
