Results
Classifier Comparison
Due to the lack of success in using the same training dataset for forward prediction, I have chosen to add a secondary analysis in which I compare several classifying methods (LDA/CDA, RandomForest, and Decision Tree). Below are the full extent visual comparisons of the different classifiers.
Discriminant Analysis
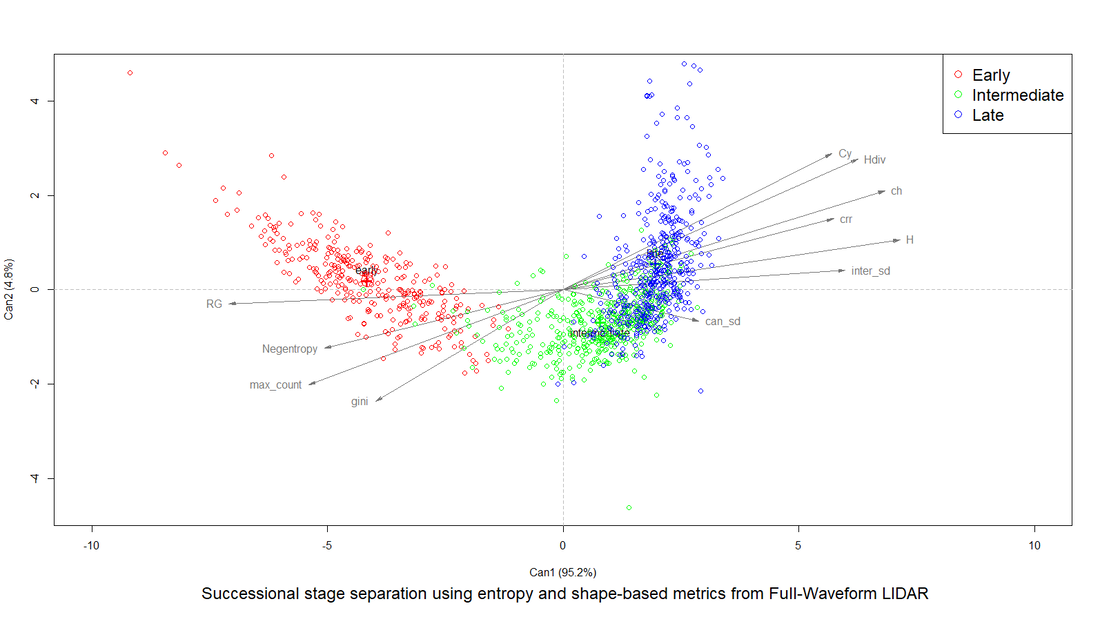
Fig 5. CANDISC (cannonical discriminant analysis) components are graphed along with the class positional means. A clear separation of early is evident, while intermediate and late appear to be near each other.
 Fig 6. Confusion Matrix results indicate a reasonable fit for the predicted values. Clear difficulties in distinguishing 'intermediate' and 'late' due to overlap.
The predicted 2005 successional stages provided excellent results. Areas that were excepted to be 'early' (northern most area, and central), were classified as 'early' and the least disturbed regions are dominantly 'late' as they should be. Expected results are based on apriori information, for example the two regions mentioned as northern and central were locations that experienced the most
recent disturbances. Some portions in the 'early' category may still be undergoing agricultural practices or cattle ranching.
One of the most indicative regions for accuracy is the red band that resembles a 'V-shape' in the North-Eastern region. This area is largely riparian, meaning that there will be much more moisture throughout the entire year resulting in greater growth, this would result in an expected 'late' classification as we see.
Confusion matrix results (right), indicate an 82% accuracy when predicting the training data. This is quite reasonable given the low number of classes and overlap that was shown in the Discriminant Analysis.
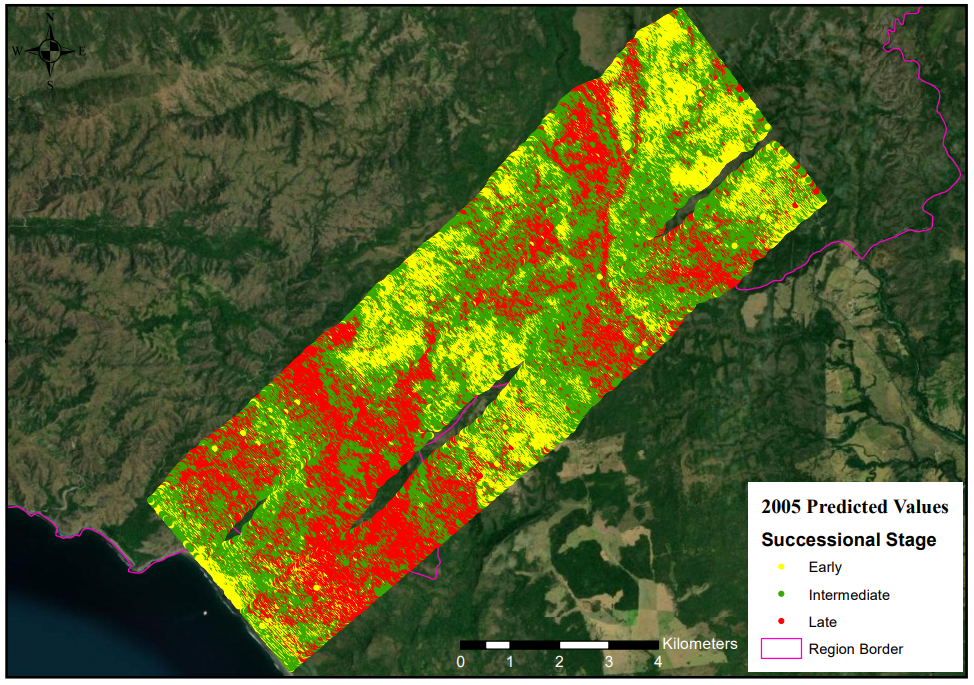
Fig 7. (Top) Full extent of the 2005 prediction values.
(Bottom-left) Subset of the 2005 prediction to match the reduced extent of the 2021 simulated data.
(Bottom-right) The extent and predicted 2021 successional values.
CART
The CART decision tree created very comparable results indicating that similar divisions between classes exist in each classifier. The decision tree seemed to be dominated by a few lower level or assumed lower importance variables such as Cx, alternative runs of this model should exclude this metric due to potential inconsistencies between instrument/data collections.
Spatially the predicted values make sense based on my assessment, the areas that I expected to classed as late are and those that should be early are mostly classified appropriately. The amount of early classed points in the south does seem to be an error, this could be an issue due to the dominance of 'ch' (canopy height) and potential topographic issues with waveform LiDAR.
Spatially the predicted values make sense based on my assessment, the areas that I expected to classed as late are and those that should be early are mostly classified appropriately. The amount of early classed points in the south does seem to be an error, this could be an issue due to the dominance of 'ch' (canopy height) and potential topographic issues with waveform LiDAR.
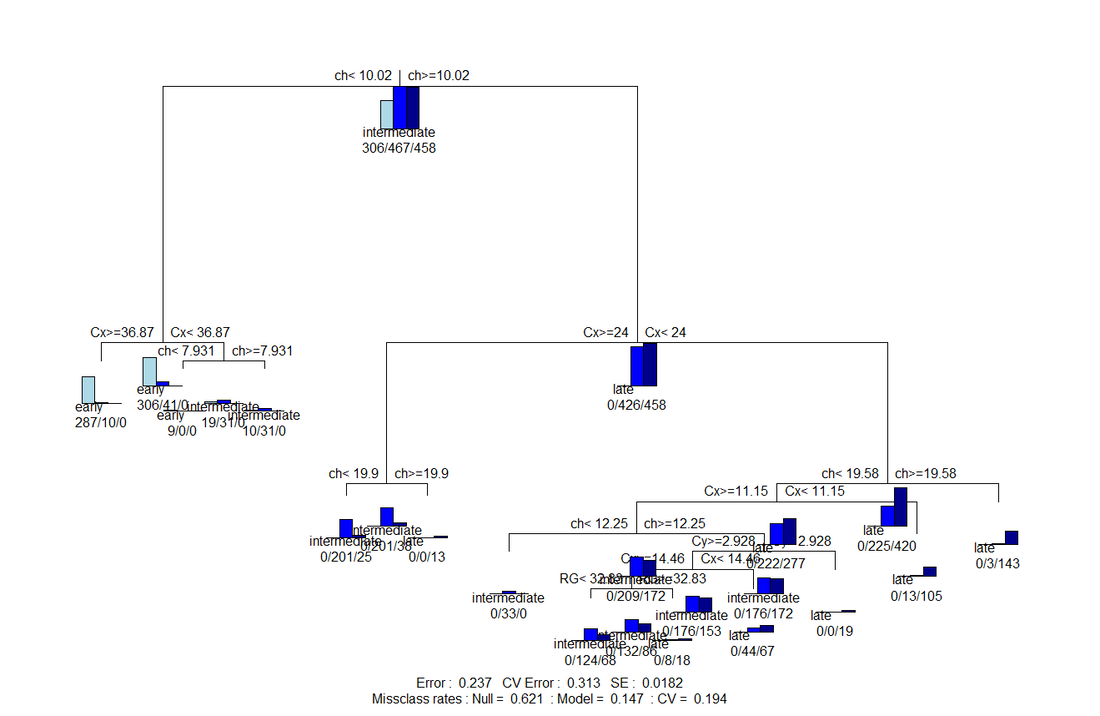
Fig 8. CART decision tree graphically represented. Main decisions seem to be dominated by a few metrics rather than dispersed across all.
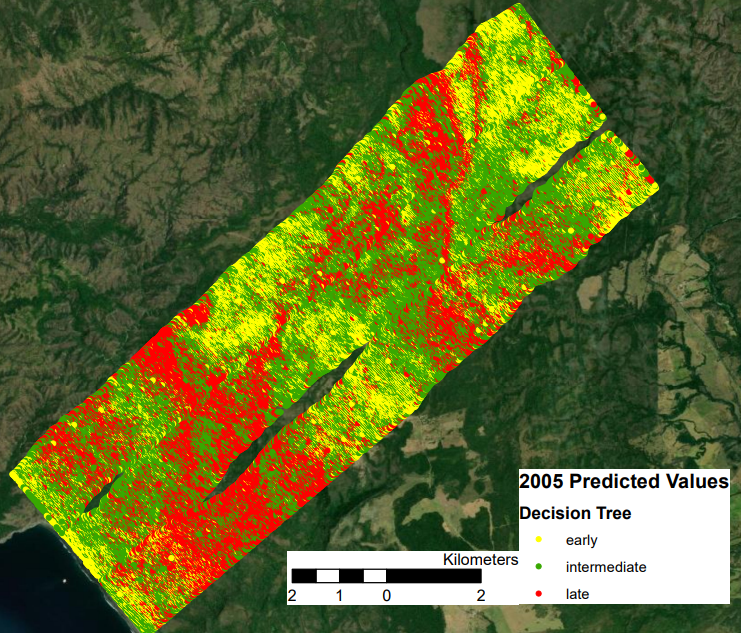
Fig 9. Spatial distribution of the CART predicted succession values.
RandomForest
The RandomForest classifier performed quite well. Having only 3 classes did prove to be the limiting factor for this classifier, similar to CART/Decision Tree. The decisions that RandomForest made are quite similar to the other classifiers. The RandomForest classifier does have a large portion of 'late' stage forest predicted. Spatially, the pattern appears quite similar across all classifiers, indicating that there are clear divides for the most part. However, there are fuzzy boundaries that are the primary drivers of error. This makes sense when considering the classification within the context of ecology where there are no hard-lines for successional stages. In the histogram below we can see the potential for RandomForest to predict additional classes. In the histogram I have shown the 3 original classes, early, intermediate and late, with additional T1 and T2 indicating transitional zones. This potential can give RandomForest an advantage over the other two methods for succession prediction.
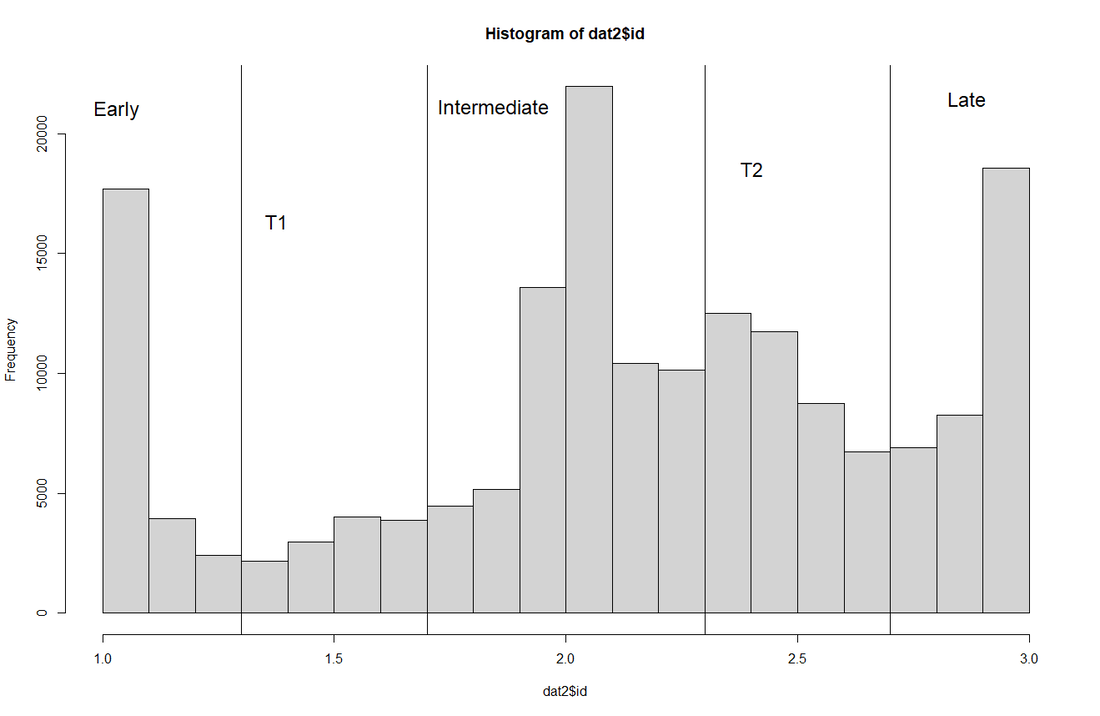
Fig 10. Rough histogram when using the RandomForest method with a continuous response. This allows for values between each class.
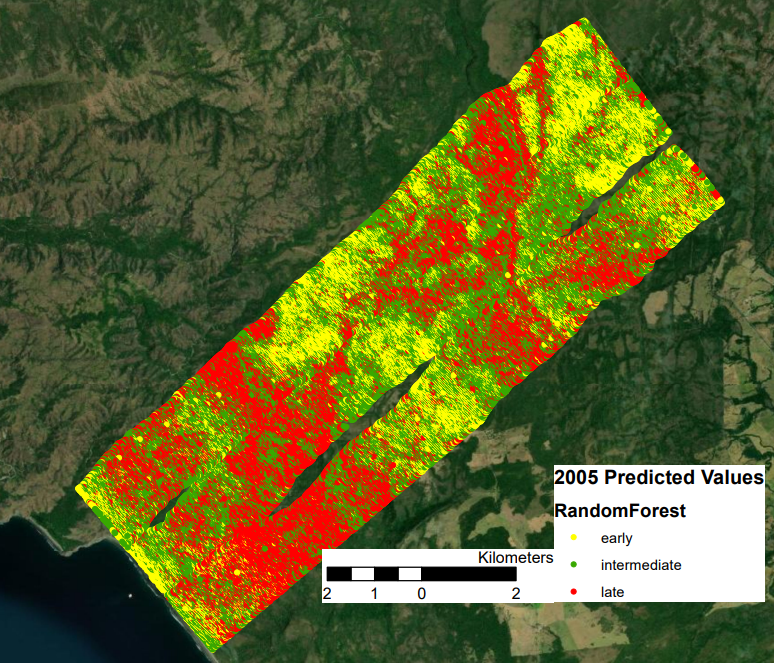
Fig 11. RandomForest predicted values. Overall, a comparable performance to the other methods.
Conclusion
Overall, the predictors all concluded in similar results. This is likely do to dominance by similar metrics as well as a low number of classes. By increasing the number of classes, I can hope to improve the separability. The CART method seemed to perform the least optimal in that the decision tree itself largely depended on a few metrics rather than considering all. Additionally, it lacked the flexibility that made RandomForest more attractive. RandomForest has the significant advantage with being able to predict between values when considering the class as a continuous variable. This can assist with making between decisions about whether or not an observation truly fits the class it has been given apriori.
