Data Collection
Waveform LiDAR is a remote sensing technique that is often under-utilized due to complexity and data intensity. LiDAR, also known as 'light ranging and detection' is a growing field in remote sensing due to its ability to provide highly detailed and accurate positional data. Typical applications of LiDAR tend to make use of its discrete product, the point cloud, which gives a 3D representation of whatever is being scanned.
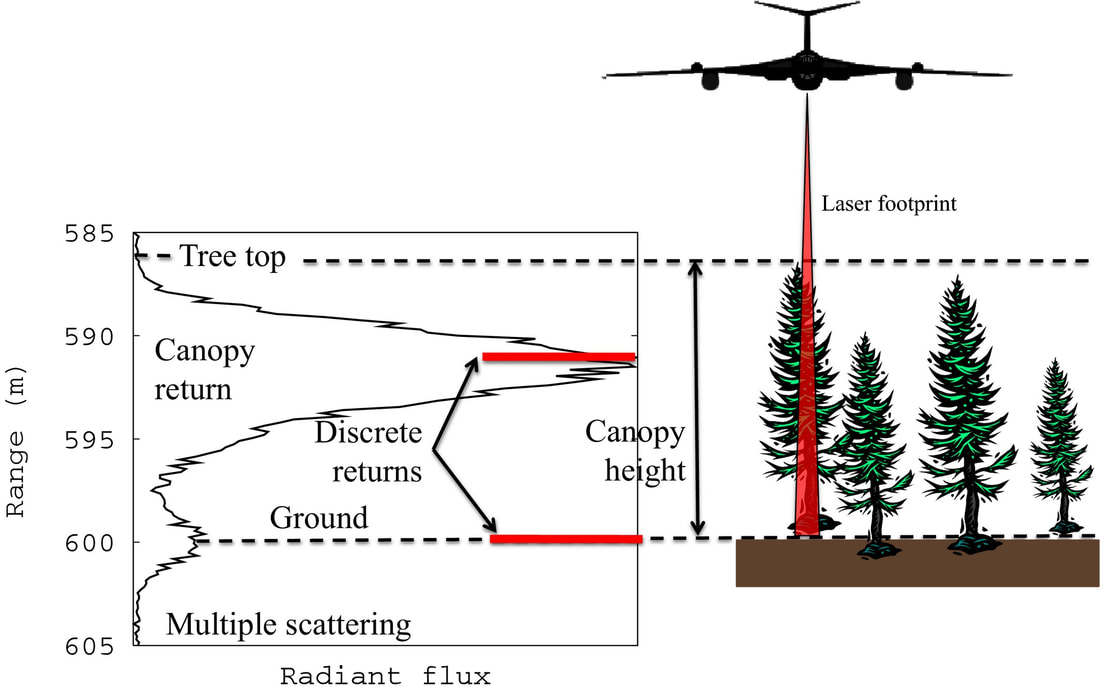
Waveform LiDAR is different in that there is not a singular return, but rather the entire energy return is digitized and recorded, usually in a ASCII/numeric format. The image on the right provides a visual representation of how a waveform would appear when determined over an area (footprint). As the image shows, the waveform may be capable of capturing the forest structure or variability within the footprint area.
Waveform LiDAR is different in that there is not a singular return, but rather the entire energy return is digitized and recorded, usually in a ASCII/numeric format. The image on the right provides a visual representation of how a waveform would appear when determined over an area (footprint). As the image shows, the waveform may be capable of capturing the forest structure or variability within the footprint area.
Study Area
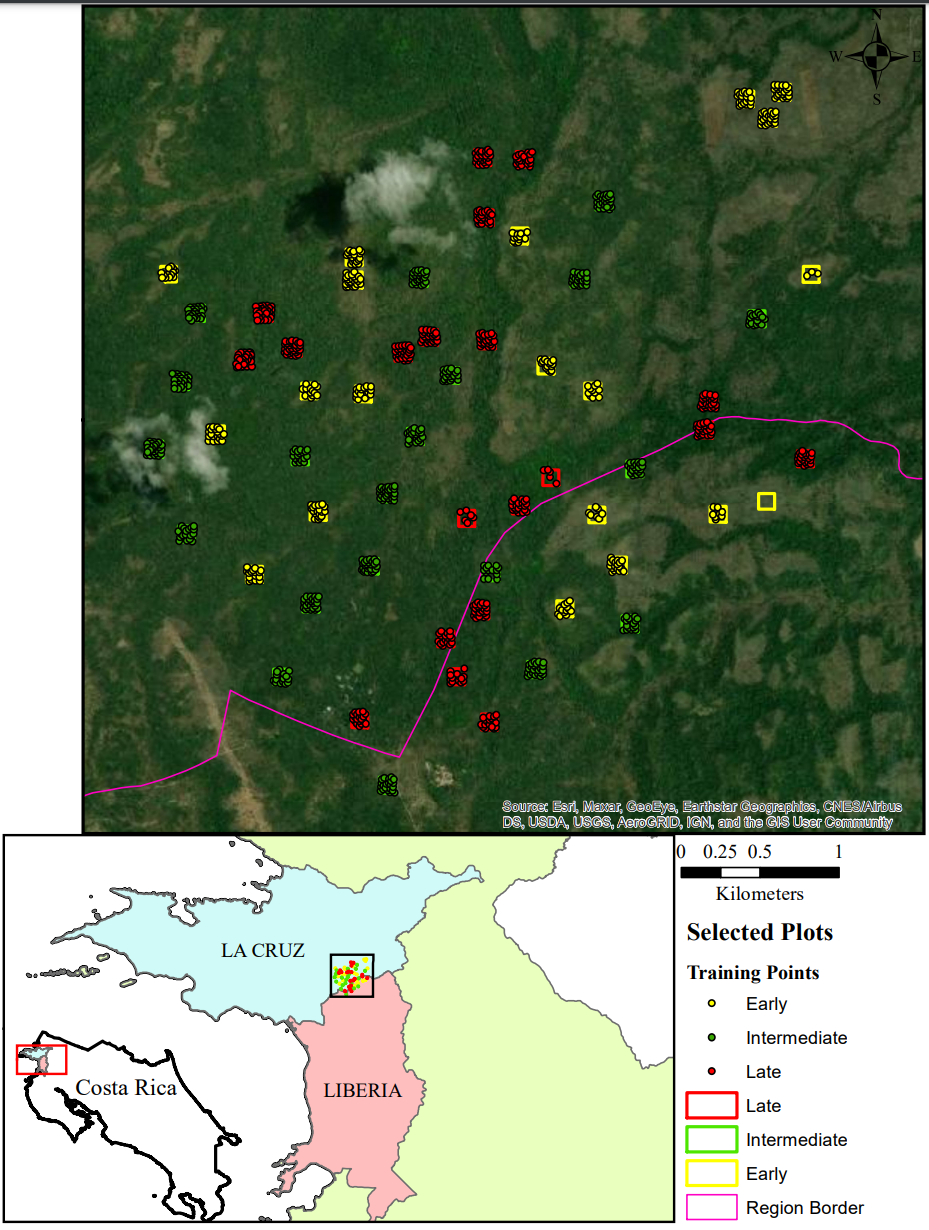
The region of interest for the study is the Santa Rosa National Park in the Guanacaste Province in Costa Rica. This region is categorized largely as secondary tropical dry forest. The forest here is considered 'secondary' due to its recent history of disturbance. The juxtaposition of the words 'tropical' and 'dry' can be somewhat confusing. This area exhibits both characteristics of a typical tropical forest and a dry forest, but are separated seasonally. For a 4 to 5 month span, this area receives a majority of its rainfall and experiences a large 'green-up' period often called "leaf-on" conditions. The second primary season is the dry season or "leaf-off", this spans a similar amount of time but as the name implies, very little to no precipitation occurs. During this time the deciduous trees lose their leaves and the forest is largely comprised of woody materials. For the purpose of this project, the 2005 dataset occurs during leaf-on conditions.
Methods of Analysis
As mentioned on the homepage, the analysis for this project largely mirrors that which was completed in Unit 4. The videos for which are linked on the homepage as well. The analysis chosen is the multivariate technique: Discriminant Analysis, more specifically a Cannonical Discriminant Analysis (CDA).
The cannonical discriminant analysis was chosen due to its ability to increase separability between previously established classes. This works well with the datasets available as the training data has previously been classified. In CDA, linear combinations of the input variables are used such that the separability between the combinations is maximize, resulting in class separation. Each variable will have a coefficient calculated as a function of the components (i.e Can1, Can2 below), this is similar to PCA (principal component analysis). Each variable may be more or less represented by one component or several. In the example below, we can see a clear divide in variables along Can1 which is accounting for a large majority of separation.
For comparison, RandomForest and CART (decision tree) methods were also used. These methods were discussed in the final unit, Unit 8, for the course. Both of these methods are extremely flexible, and can be used with continuous or categorical response and predictor variables. This flexibility makes these methods highly attractive to remote sensing classifications. For my project, these methods will be used to predict th successional stage similar to the discriminant analysis, all methods will then be compared. This is diverging from the original intent of the project which was to compare changes in succession over time, unfortunately the lack of current reference values causes complications with the 2021 classifications. In place of that analysis, I will be presenting 3 methods for classification using the 2005 dataset and observing each methods pros and cons with respect to classification.
The CART analysis is applied on the categorical variable class. In this case 'class' is considered a categorical response. The structure metrics are then used to establish the relationship to succession class. The version of CART used in this study is the univariate method because class is the only response variable being predicted. Each class creates a cluster and the variable thresholds for each class are determined for the prediction. As shown in the results, the decision tree shows a proportion of each class at each decision.
The third classifier chosen is the RandomForest method. RandomForest is a bootstrapped version of the CART method which builds multiple trees using subsets of the data and builds the classifiers around the averages and a regression. In my implementation, I used 200 trees for prediction. This means that 200 different trees are used to obtain the average value of prediction. This method can make use of both continuous and categorical values for successional class. When using categorical (early, intermediate, late) a majority vote is used to determine the predicted class. If the successional class is considered continuous, in this case early would equal 1, intermediate equal 2, and late equal 3, the resulting predictions can occur as any values between that range. This can be advantageous in that we can obtain middle values that can then be used to create additional classes if one wishes. For the sake of comparison with Discriminant Analysis, I have opted for categorical for 3 classes.


